Best Pandas Data Analysis Tools to Buy in February 2026
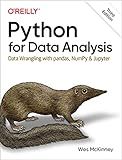
Python for Data Analysis: Data Wrangling with pandas, NumPy, and Jupyter


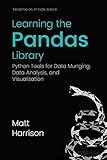
Learning the Pandas Library: Python Tools for Data Munging, Analysis, and Visual


Pandas Cookbook: Practical recipes for scientific computing, time series, and exploratory data analysis using Python


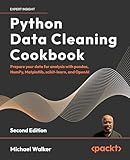
Python Data Cleaning Cookbook: Prepare your data for analysis with pandas, NumPy, Matplotlib, scikit-learn, and OpenAI


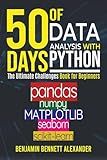
50 Days of Data Analysis with Python: The Ultimate Challenges Book for Beginners.: Hands-on Challenges with pandas, NumPy, Matplotlib, Sklearn and Seaborn



Effective Pandas: Patterns for Data Manipulation (Treading on Python)


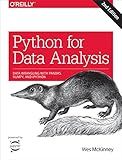
Python for Data Analysis: Data Wrangling with Pandas, NumPy, and IPython


Python for Data Analysis: Data Wrangling with Pandas, NumPy, and IPython


Python for Excel: A Modern Environment for Automation and Data Analysis


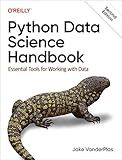
Python Data Science Handbook: Essential Tools for Working with Data


To describe a column in Pandas Python, you can utilize the describe() method which provides a summary of statistical information about the column. This descriptive statistics summary helps you gain a better understanding of the data distribution in that specific column. Here's how you can describe a column in Pandas:
First, make sure you have imported the pandas library:
import pandas as pd
Next, you can create a DataFrame or read in a dataset using the read_csv() function:
df = pd.read_csv('your_dataset.csv')
Now, you can use the describe() function on a specific column of the DataFrame. For example, if you have a column named "column_name" in your DataFrame, you can describe it as follows:
column_description = df['column_name'].describe()
The describe() method will calculate various statistical attributes of the column, including count, mean, standard deviation, minimum value, 25th percentile, median, 75th percentile, and maximum value. The output will be a Pandas series object.
You can print the resulting description by simply displaying the column_description variable:
print(column_description)
This will provide you with a summary of the statistical information about the column, giving insights into its distribution, range, and central tendency.
By describing a column, you can quickly obtain valuable information about your data and make informed decisions when analyzing or manipulating it.
How to replace values in a column with another value in Pandas?
To replace values in a column with another value in Pandas, you can use the replace() method. Here are the steps:
- Import the pandas library:
import pandas as pd
- Create a DataFrame:
data = {'Name': ['John', 'Alice', 'Bob', 'Sarah', 'Nick'], 'Age': [28, 25, 32, 31, 29], 'City': ['New York', 'London', 'Paris', 'Sydney', 'Berlin']} df = pd.DataFrame(data)
- Use the replace() method to replace values in a specific column:
df['City'] = df['City'].replace('New York', 'Los Angeles')
This will replace all occurrences of 'New York' in the 'City' column with 'Los Angeles'.
- Alternatively, you can use replace() method with a dictionary to replace multiple values in a column:
df['City'] = df['City'].replace({'New York': 'Los Angeles', 'London': 'San Francisco'})
This will replace 'New York' with 'Los Angeles' and 'London' with 'San Francisco' in the 'City' column.
- You can also use regular expressions to replace values using replace() method:
df['City'] = df['City'].replace(r'^[A-Z].*$', 'Unknown', regex=True)
This will replace all values that start with an uppercase letter in the 'City' column with 'Unknown'.
- Print the updated DataFrame:
print(df)
The output will be:
Name Age City 0 John 28 Los Angeles 1 Alice 25 San Francisco 2 Bob 32 Paris 3 Sarah 31 Sydney 4 Nick 29 Berlin
By using the replace() method, you can easily replace values in a column with another value in Pandas.
What is the syntax to describe a column in Pandas Python?
To describe a column in Pandas Python, you can use the following syntax:
df['column_name']
Here, df is the name of your DataFrame, and 'column_name' is the name of the column you want to describe or access. This will return the specified column as a Series object.
How to filter rows based on multiple conditions in columns?
To filter rows based on multiple conditions in columns, you can use the Pandas library in Python. Here's a step-by-step guide:
- Import the Pandas library:
import pandas as pd
- Read your dataset into a Pandas DataFrame:
df = pd.read_csv("your_dataset.csv")
- Define your conditions using logical operators (& for "and", | for "or", and ~ for "not"). For example, let's say you want to filter rows where column1 is greater than 10 and column2 is equal to 'A':
condition1 = df['column1'] > 10 condition2 = df['column2'] == 'A'
- Combine the conditions using the logical operators:
filtered_df = df[condition1 & condition2]
- If you have more conditions, continue combining them:
condition3 = df['column3'].isnull() filtered_df = df[condition1 & condition2 & ~condition3]
- Finally, you can access the filtered rows in the filtered_df.
This method allows you to filter rows based on any number of conditions in multiple columns using logical operators.
How to count the occurrences of each value in a column?
To count the occurrences of each value in a column, you can use several methods depending on the software or programming language you are using. Here are a few examples:
- Excel: Select the column you want to count the occurrences in. Go to the "Formulas" tab. Click on "More Functions" and select "Statistical". Choose "COUNTIF" from the list. In the "Range" field, enter the range of cells in the column. In the "Criteria" field, enter the specific value you want to count occurrences for. Hit Enter and the count will appear in the selected cell.
- Python (Pandas library): Import the Pandas library: import pandas as pd Read the data into a DataFrame: df = pd.read_csv('data.csv') (replace 'data.csv' with your file name) Use the value_counts() method to count the occurrences of each value in the column: counts = df['column_name'].value_counts() The counts variable will now contain a series with each value from the column as the index and their respective counts as the values.
- SQL: Write a query that counts occurrences using the GROUP BY clause: SELECT column_name, COUNT(*) as occurrences FROM table_name GROUP BY column_name; Replace column_name with the name of your column and table_name with the name of your table. Run the query, and it will return each value in the column with its respective occurrence count.
These are just a few examples, but the method may vary depending on the software or programming language you are using.
What is the command to count the number of unique values in a column?
The command to count the number of unique values in a column depends on the software or tool you are using to work with data. Here are a few examples:
In Microsoft Excel or Google Sheets, you can use the COUNTUNIQUE function. The syntax is:
=COUNTUNIQUE(range)
For example, if you want to count the unique values in column A from row 2 to 10, the formula would be:
=COUNTUNIQUE(A2:A10)
In SQL, you can use the SELECT DISTINCT statement combined with the COUNT() function. The syntax is:
SELECT COUNT(DISTINCT column_name) FROM table_name;
For example, if you want to count the unique values in a column named "column_name" from a table named "table_name", the query would be:
SELECT COUNT(DISTINCT column_name) FROM table_name;
In Python with pandas library, you can use the nunique() function. The syntax is:
df['column_name'].nunique()
For example, if you have a DataFrame called "df" and you want to count the unique values in a column named "column_name", the code would be:
df['column_name'].nunique()
These are just a few examples, and the specific command may vary depending on the software or tool you are using.
What is the command to check for missing values in a column?
The command to check for missing values in a column may vary depending on the programming language or software you are using. However, in Python with the pandas library, you can use the isnull() or isna() function along with the sum() function to count the missing values in a specific column. Here's an example:
import pandas as pd
Create a dataframe
data = {'column1': [1, 2, None, 4, 5], 'column2': [6, None, 8, 9, 10]} df = pd.DataFrame(data)
Check for missing values in 'column1'
missing_values = df['column1'].isnull().sum() print("Number of missing values in 'column1':", missing_values)
The output would be:
Number of missing values in 'column1': 1
In this example, the isnull() function is used to create a boolean mask to identify the missing values in 'column1', and the sum() function is used to count the number of True values (missing values in this case).
