Best Descriptive Statistics Books to Buy in February 2026
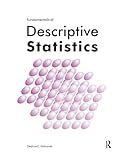
Fundamentals of Descriptive Statistics
- AFFORDABLE PRICES FOR QUALITY PRE-OWNED LITERATURE.
- THOROUGHLY CHECKED FOR QUALITY AND READABILITY.
- ECO-FRIENDLY CHOICE: PROMOTE SUSTAINABILITY WHILE READING!


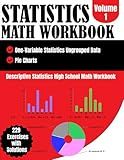
Descriptive Statistics High School Math Workbook Volume: Pie Charts, One Variable Ungrouped Data, 229 Exercises With Solutions


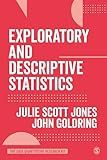
Exploratory and Descriptive Statistics (The SAGE Quantitative Research Kit)


Statistics with JMP: Graphs, Descriptive Statistics and Probability


Introduction to Python in Earth Science Data Analysis: From Descriptive Statistics to Machine Learning (Springer Textbooks in Earth Sciences, Geography and Environment)


Statistics: Informed Decisions Using Data (5th Edition)-Stand alone


To calculate descriptive statistics in Pandas, you can use various functions provided by the library. Here are some commonly used functions:
- Mean: You can calculate the mean of a column using the mean() function. It computes the average of the values in the column.
- Median: The median can be calculated using the median() function. It gives the middle value of a dataset when ordered.
- Mode: To find the mode, use the mode() function. It returns the most common value(s) in a dataset.
- Standard Deviation: The std() function is used to calculate the standard deviation. It measures the amount of variation or dispersion in the data.
- Variance: You can compute the variance using the var() function. It indicates how spread out the dataset is.
- Minimum and Maximum: To find the minimum and maximum values in a column, use the min() and max() functions, respectively.
- Quartiles: The quantile() function can be used to calculate quartiles. It gives the values that separate the data into quarters (25th percentile, median, and 75th percentile).
- Count: To count the number of non-null values in a column, you can use the count() function.
- Sum: The sum() function calculates the sum of the values in a column.
- Range: Range can be derived by subtracting the minimum value from the maximum value.
These functions can be applied to individual columns or entire dataframes. By utilizing them, you can gain valuable insights into your data and understand its central tendency, dispersion, and distribution.
How to calculate the sum in Pandas?
In Pandas, you can use the sum() method to calculate the sum of values in a particular column or across the entire DataFrame. Here are some examples:
- Sum of values in a single column:
df['column_name'].sum()
- Sum of values across all columns:
df.sum()
- Sum of values in each row:
df.sum(axis=1)
Note that if your DataFrame contains non-numeric values, the sum() method will attempt to convert them to numeric types. If the conversion fails, it will return an error. In such cases, you may need to specify a subset of columns or use additional parameters to handle non-numeric data.
You can also control the axis along which the sum is calculated by changing the axis parameter. By default, axis=0, which sums values vertically (column-wise). Setting axis=1 sums values horizontally (row-wise).
If you want to exclude missing or NaN values when calculating the sum, you can use the skipna parameter. By default, skipna=True, which skips NaNs, but you can set it to False to include NaNs in the sum calculation.
Here's an example usage:
import pandas as pd
data = {'A': [1, 2, 3, 4, 5], 'B': [10, 20, 30, 40, 50]} df = pd.DataFrame(data)
column_sum = df['A'].sum() print("Sum of column 'A':", column_sum)
row_sum = df.sum(axis=1) print("Sum of each row:\n", row_sum)
whole_df_sum = df.sum() print("Sum across all columns:\n", whole_df_sum)
Output:
Sum of column 'A': 15 Sum of each row: 0 11 1 22 2 33 3 44 4 55 dtype: int64 Sum across all columns: A 15 B 150 dtype: int64
How to calculate the covariance in Pandas?
To calculate the covariance in pandas, you can use the cov() function. This function is available for a pandas DataFrame or Series object.
Here's an example using a DataFrame:
import pandas as pd
Create a DataFrame
data = {'x': [1, 2, 3, 4, 5], 'y': [5, 4, 3, 2, 1]} df = pd.DataFrame(data)
Calculate covariance
covariance = df['x'].cov(df['y']) print("Covariance:", covariance)
Output:
Covariance: -2.5
In this example, we calculate the covariance between the 'x' and 'y' columns of the DataFrame df. The cov() function returns the covariance between two variables.
What is the difference between mean and median in descriptive statistics?
The mean and median are both measures of central tendency in descriptive statistics, but they differ in how they represent the data.
- Mean: The mean is the average of a set of numbers. It is calculated by summing up all the values in the dataset and dividing it by the total number of observations. The mean is sensitive to extreme values or outliers in the dataset, as it takes into account every value in the calculation. It is often used to represent a typical or average value in a dataset.
- Median: The median is the middle value in a sorted dataset, separating the upper half from the lower half. If there are an odd number of observations, then the median is the middle value. If there are an even number of observations, the median is the average of the two middle values. The median is not affected by extreme values or outliers, as it only considers the position of values within the data. It is often used when the dataset is skewed or contains outliers, providing a measure of the central value without being influenced by extreme values.
In summary, the mean represents the average value of the dataset and is influenced by outliers, while the median represents the middle value and is not affected by outliers.
How to calculate the mean in Pandas?
In Pandas, you can calculate the mean of a DataFrame or Series using the mean() function. Here are the steps to calculate the mean:
- Import the pandas library:
import pandas as pd
- Create a DataFrame or Series:
data = {'Col1': [1, 2, 3, 4, 5], 'Col2': [6, 7, 8, 9, 10]} df = pd.DataFrame(data)
- Use the mean() function to calculate the mean:
mean_value = df.mean()
- Print the mean value:
print(mean_value)
The mean() function returns the mean of each column in the DataFrame. If you want to calculate the mean of a specific column, you can specify the column name as an argument to the mean() function:
mean_value = df['Col1'].mean()
