Best Pyspark Books to Buy in February 2026
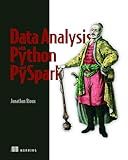
Data Analysis with Python and PySpark


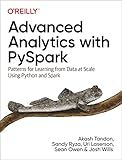
Advanced Analytics with PySpark: Patterns for Learning from Data at Scale Using Python and Spark


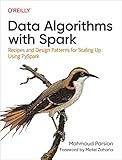
Data Algorithms with Spark: Recipes and Design Patterns for Scaling Up using PySpark


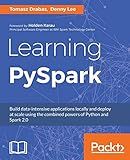
Learning PySpark


Essential PySpark for Scalable Data Analytics: A beginner's guide to harnessing the power and ease of PySpark 3



Introduction to pyspark


To get a pandas dataframe using PySpark, you can first create a PySpark dataframe from your data using the PySpark SQL module. Then, you can use the toPandas() function to convert the PySpark dataframe into a pandas dataframe. This function will collect all the data from the PySpark dataframe into the driver node of the Spark cluster and convert it into a pandas dataframe.
Keep in mind that this method is not recommended for large datasets, as collecting all the data into the driver node can cause memory issues. It is best used for smaller datasets that can fit into memory. Also, using the toPandas() function can be an expensive operation in terms of performance, so it should be used sparingly.
What is the syntax for SQL queries on a PySpark DataFrame?
The syntax for SQL queries on a PySpark DataFrame is as follows:
- Register the DataFrame as a temporary table:
df.createOrReplaceTempView("table_name")
- Use the sql method on the SparkSession to execute SQL queries on the DataFrame:
result = spark.sql("SELECT column1, column2 FROM table_name WHERE condition")
- To show the result of the SQL query, you can use the show method:
result.show()
Note: The spark object represents the SparkSession and df represents the PySpark DataFrame on which you want to execute SQL queries.
What is the syntax for creating a PySpark DataFrame from a CSV file?
To create a PySpark DataFrame from a CSV file, you can use the spark.read.csv() method. Here is the syntax for creating a PySpark DataFrame from a CSV file:
from pyspark.sql import SparkSession
Create a Spark session
spark = SparkSession.builder \ .appName("example") \ .getOrCreate()
Read CSV file into a DataFrame
df = spark.read.csv("path/to/your/csv/file.csv", header=True, inferSchema=True)
Show the DataFrame
df.show()
In the above syntax:
- "example" is the name of the Spark application
- "path/to/your/csv/file.csv" is the path to the CSV file you want to read
- header=True specifies that the first row of the CSV file contains the column names
- inferSchema=True attempts to infer the data types of each column
You can also provide additional options to the spark.read.csv() method, such as specifying a custom delimiter, encoding, or handling null values.
How to perform data aggregation in a PySpark DataFrame?
In PySpark, data aggregation can be performed using the groupBy() and agg() functions. Here's how you can perform data aggregation in a PySpark DataFrame:
- Import required modules:
from pyspark.sql import SparkSession from pyspark.sql import functions as F
- Create a SparkSession:
spark = SparkSession.builder.appName("DataAggregation").getOrCreate()
- Read data into a PySpark DataFrame:
data = [("John", "Sales", 3000), ("David", "Marketing", 4000), ("Nick", "Sales", 3500), ("Anna", "Marketing", 5000), ("Amy", "Sales", 4500)]
columns = ["Name", "Department", "Salary"] df = spark.createDataFrame(data, schema=columns)
- Perform data aggregation using groupBy() and agg() functions:
# Group by department and calculate total salary and average salary agg_df = df.groupBy("Department").agg(F.sum("Salary").alias("TotalSalary"), F.avg("Salary").alias("AvgSalary"))
Show the aggregated data
agg_df.show()
In this example, we have grouped the data by the "Department" column and calculated the total and average salary for each department using the sum() and avg() functions in the agg() method. Finally, we displayed the aggregated data using the show() method.
You can perform various other aggregation operations such as max(), min(), count(), etc. using the agg() function on PySpark DataFrames.
How to group data in a PySpark DataFrame?
To group data in a PySpark DataFrame, you can use the groupBy() method. This method allows you to group rows based on one or more columns in the DataFrame. Here is an example of grouping data in a PySpark DataFrame:
# Import necessary libraries from pyspark.sql import SparkSession
Create a Spark session
spark = SparkSession.builder.appName("grouping_data").getOrCreate()
Create a sample DataFrame
data = [("Alice", 34, "Sales"), ("Bob", 45, "Marketing"), ("Charlie", 28, "Sales"), ("David", 50, "Marketing")]
columns = ["Name", "Age", "Department"] df = spark.createDataFrame(data, columns)
Group data based on the "Department" column
grouped_df = df.groupBy("Department").count()
Show the results
grouped_df.show()
In this example, we first create a sample DataFrame using the createDataFrame() method. We then use the groupBy() method to group the data based on the "Department" column and count the number of rows in each group using the count() method. Finally, we use the show() method to display the results.
