Best Python Pandas Guides to Buy in January 2026

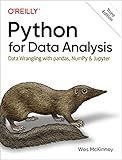
Python for Data Analysis: Data Wrangling with pandas, NumPy, and Jupyter


Pandas Cookbook: Practical recipes for scientific computing, time series, and exploratory data analysis using Python


Pandas Workout: 200 exercises to make you a stronger data analyst


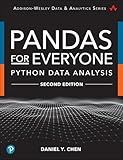
Pandas for Everyone: Python Data Analysis (Addison-Wesley Data & Analytics Series)


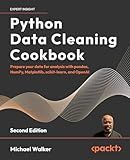
Python Data Cleaning Cookbook: Prepare your data for analysis with pandas, NumPy, Matplotlib, scikit-learn, and OpenAI


Pandas for Everyone: Python Data Analysis (Addison-Wesley Data & Analytics Series)


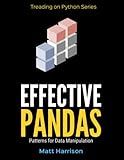
Effective Pandas: Patterns for Data Manipulation (Treading on Python)


To calculate percentages using pandas groupby, you can first group the data by the desired column(s) using the groupby function. Then, use the size() function to count the number of entries in each group. Finally, you can calculate the percentage by dividing the count of each group by the total count of all groups and multiplying by 100. This will give you the percentage of each group relative to the total.
How to calculate rolling percentages using pandas groupby?
To calculate rolling percentages using pandas groupby, you can first group the data using the groupby() function, then apply the rolling() function to calculate rolling sums or rolling averages for each group. Finally, you can divide the rolling sums or rolling averages by a relevant total to calculate the rolling percentages.
Here's an example of how to calculate rolling percentages using pandas groupby:
import pandas as pd
Create a sample DataFrame
data = { 'group': ['A', 'A', 'A', 'B', 'B', 'B'], 'value': [10, 20, 30, 15, 25, 35] } df = pd.DataFrame(data)
Group by 'group' column and calculate rolling sum
df['rolling_sum'] = df.groupby('group')['value'].rolling(window=2).sum().reset_index(drop=True)
Calculate the total sum for each group
df['group_total'] = df.groupby('group')['value'].transform('sum')
Calculate the rolling percentage
df['rolling_percentage'] = (df['rolling_sum'] / df['group_total']) * 100
print(df)
This will output a DataFrame with the rolling sum, group total, and rolling percentage for each row based on the group column.
You can adjust the window parameter in the rolling() function to change the window size for calculating the rolling sum or rolling average.
How to handle errors when calculating percentages using groupby in pandas?
When calculating percentages using groupby in pandas, it's important to handle errors that may arise during the calculation. Here are some ways to handle errors:
- Check for missing values: Before calculating percentages, make sure to check for missing values in the data. You can use the isnull() method to identify missing values and decide how to handle them (e.g., filling missing values with zeros or dropping rows with missing values).
- Handle divide by zero errors: When dividing values to calculate percentages, there may be cases where the denominator is zero, leading to a division by zero error. To avoid this, you can use the np.where() function to replace zero denominators with a specified value (e.g., NaN or zero).
import numpy as np
data['percentage'] = np.where(data['denominator'] != 0, data['numerator'] / data['denominator'], np.nan)
- Use try-except blocks: If you anticipate specific errors that may occur during the calculation of percentages, you can use try-except blocks to catch and handle these errors gracefully.
try: data['percentage'] = data['numerator'] / data['denominator'] except ZeroDivisionError: print("Division by zero error occurred. Handling the error...") data['percentage'] = np.nan
- Use the errors parameter in pandas functions: When using pandas functions like groupby, you can specify the errors parameter to handle errors during the calculation. For example, you can set errors='coerce' to replace errors with NaN values.
data.groupby('group').apply(lambda x: x['numerator'] / x['denominator'], errors='coerce')
By following these steps, you can effectively handle errors when calculating percentages using groupby in pandas and ensure that your analysis is accurate and reliable.
What is the comparison between groupby and pivot_table functions in pandas?
The groupby and pivot_table functions in pandas are both used for aggregating and summarizing data, but they have some key differences:
- Groupby:
- The groupby function is used for creating groups based on one or more columns in a DataFrame.
- It allows for grouping data based on one or more columns and applying aggregation functions like sum, mean, count, etc.
- It returns a GroupBy object which can then be used to apply aggregate functions to each group.
- The resulting DataFrame will have a hierarchical index based on the grouping columns.
- Pivot_table:
- The pivot_table function is used for creating a spreadsheet-style pivot table from a DataFrame.
- It allows for reshaping data and summarizing it in a tabular format, with rows and columns specified by the user.
- It requires the specification of the index, columns, and values to be used for grouping and aggregating the data.
- It can handle missing values by filling them with a specified fill_value parameter.
In summary, groupby is more flexible and allows for grouping data based on multiple columns and applying various aggregation functions, while pivot_table is more specialized for creating pivot tables with a tabular format.
