Best Tools for Data Analysis to Buy in January 2026
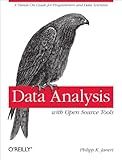
Data Analysis with Open Source Tools: A Hands-On Guide for Programmers and Data Scientists


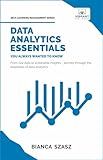
Data Analytics Essentials You Always Wanted To Know : A Practical Guide to Data Analysis Tools and Techniques, Big Data, and Real-World Application for Beginners


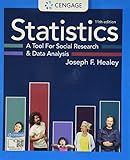
Statistics: A Tool for Social Research and Data Analysis (MindTap Course List)


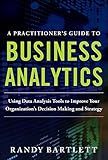
A PRACTITIONER'S GUIDE TO BUSINESS ANALYTICS: Using Data Analysis Tools to Improve Your Organization’s Decision Making and Strategy
- QUALITY ASSURANCE: ALL USED BOOKS ARE INSPECTED FOR GOOD CONDITION!
- AFFORDABLE PRICES: SAVE BIG ON QUALITY READS WITHOUT THE FULL PRICE!
- ECO-FRIENDLY CHOICE: REDUCE WASTE BY CHOOSING PRE-OWNED BOOKS TODAY!


Python Data Science Handbook: Essential Tools for Working with Data
- COMPREHENSIVE GUIDES ON DATA MANIPULATION AND ANALYSIS TECHNIQUES.
- HANDS-ON EXAMPLES USING REAL-WORLD DATASETS FOR PRACTICAL LEARNING.
- ESSENTIAL TOOLS FOR MACHINE LEARNING AND DATA VISUALIZATION SKILLS.


Advanced Data Analytics with AWS: Explore Data Analysis Concepts in the Cloud to Gain Meaningful Insights and Build Robust Data Engineering Workflows ... (Data Analyst — AWS + Databricks Path)


Outliers are extreme or abnormal values that do not conform to the overall pattern or distribution of a dataset. In a Pandas DataFrame, handling outliers is crucial to ensure accurate analysis and modeling. Here are some common approaches for dealing with outliers in a Pandas DataFrame:
- Identifying outliers: Before handling outliers, it is essential to identify them in the DataFrame. A common technique is to use statistical measures such as the z-score or interquartile range (IQR) to detect values that deviate significantly from the mean or median.
- Removing outliers: One way to handle outliers is to simply remove them from the DataFrame. This can be done using boolean indexing, where rows that contain outlier values are filtered out. However, removing outliers may result in loss of valuable information, so it should be employed cautiously.
- Replacing outliers: Instead of removing outliers, you can replace them with more reasonable values. For example, you can replace outliers with the mean, median, or a predefined value based on domain knowledge. This approach helps retain the data while reducing the impact of outliers on analysis.
- Transforming data: Another approach is to apply mathematical transformations to the data. For instance, you can use logarithmic or square root transformations to spread out extreme values and make them less influential.
- Winsorization: Winsorization involves replacing extreme values with the nearest non-extreme values. This technique limits the influence of outliers while maintaining the overall distribution of the data. The limits for winsorization can be determined using percentiles or standard deviations.
- Binning: Binning involves dividing the values of a variable into groups or bins. This can help smooth out the impact of outliers by grouping them with nearby values. You can then replace the outlier values with the bin's mean, median, or other representative statistic.
- Domain-specific knowledge: Sometimes, outliers can represent genuine and meaningful data points. In such cases, it is essential to consult domain experts who can provide insights into whether these outliers should be removed, transformed, or retained for analysis.
Remember, the approach to handling outliers depends on the specific dataset, the nature of the outliers, and the goals of the analysis. It is crucial to evaluate the impact of outlier handling techniques and choose the most appropriate method to prevent bias and ensure accurate data analysis.
How to calculate the IQR for a Pandas DataFrame column?
To calculate the Interquartile Range (IQR) for a column in a Pandas DataFrame, you can use the quantile() method to find the value of the 25th and 75th percentiles. Then, subtract the first quartile (Q1) from the third quartile (Q3) to get the IQR.
Here's an example of how to calculate the IQR for a column named 'col' in a DataFrame named 'df':
import pandas as pd
Calculate Q1, Q3, and IQR
Q1 = df['col'].quantile(0.25) Q3 = df['col'].quantile(0.75) IQR = Q3 - Q1
print("Interquartile Range (IQR):", IQR)
In this example, quantile(0.25) returns the value below which 25% of the data falls, and quantile(0.75) returns the value below which 75% of the data falls. Subtracting Q1 from Q3 gives you the range where the middle 50% of the data falls, which is the IQR.
Note: This calculation assumes that the DataFrame column contains numerical data.
How to detect outliers in a Pandas DataFrame?
There are several ways to detect outliers in a Pandas DataFrame. Here, I will describe three common methods:
- Z-Score method: This method detects outliers by computing the Z-score of each data point. A Z-score tells you how many standard deviations an observation is from the mean. Typically, a Z-score threshold of 3 is used, meaning any observation with a Z-score greater than 3 or less than -3 can be considered as an outlier. from scipy import stats import numpy as np # Compute Z-score for each column in the DataFrame z_scores = np.abs(stats.zscore(df)) # Set a threshold value for outliers threshold = 3 # Find the indices of outliers outlier_indices = np.where(z_scores > threshold) # Print the outlier indices print(outlier_indices)
- IQR method: This method uses the Interquartile Range (IQR) to detect outliers. The IQR is the range between the first quartile (25%) and the third quartile (75%). Any observation below the first quartile minus 1.5 times the IQR or above the third quartile plus 1.5 times the IQR can be considered as an outlier. # Calculate IQR for each column in the DataFrame Q1 = df.quantile(0.25) Q3 = df.quantile(0.75) IQR = Q3 - Q1 # Set the multiplier for outlier detection threshold = 1.5 # Find the indices of outliers outlier_indices = np.where((df < (Q1 - threshold * IQR)) | (df > (Q3 + threshold * IQR))) # Print the outlier indices print(outlier_indices)
- Tukey's fences method: This method is similar to the IQR method but uses a stricter threshold. Any observation below the first quartile minus 3 times the IQR or above the third quartile plus 3 times the IQR can be considered as an outlier. # Calculate IQR for each column in the DataFrame Q1 = df.quantile(0.25) Q3 = df.quantile(0.75) IQR = Q3 - Q1 # Set the multiplier for outlier detection threshold = 3 # Find the indices of outliers outlier_indices = np.where((df < (Q1 - threshold * IQR)) | (df > (Q3 + threshold * IQR))) # Print the outlier indices print(outlier_indices)
Remember to apply these methods with caution and consider the context and characteristics of your data before treating outliers.
What is targeted outlier handling and how does it work with Pandas?
Targeted outlier handling is a technique used for dealing with outliers in a dataset. It involves identifying outliers in a specific column or feature and then applying a targeted strategy to handle them. The goal is to treat outliers differently based on their impact on a specific target variable.
Pandas is a popular Python library for data manipulation and analysis. It provides various functionalities to handle data outliers, including targeted outlier handling. Here's how to perform targeted outlier handling using Pandas:
- Identify the target variable: Determine the variable you want to analyze and understand the impact of outliers on it.
- Detect outliers: Use statistical methods or visualization techniques to detect outliers in the target variable. Common methods include the use of Z-score, IQR (Interquartile Range), or box plots.
- Create a filter: Based on the identified outliers, create a filter or boolean mask that specifies the rows containing outliers in the target column.
- Handle outliers: Apply a specific strategy to address the outliers in the target column. This strategy may vary based on the problem domain and specific requirements. Some common techniques include removal, replacement with a central tendency value (mean, median), or winsorization (replacing outliers with the nearest non-outlying values).
- Update the DataFrame: Apply the outlier handling strategy by updating the filtered rows in the target column of the DataFrame.
Example code using Pandas for targeted outlier handling:
import pandas as pd
Assuming 'df' is the DataFrame containing the data
target_column = 'target_variable'
Step 2: Detect outliers
z_score_threshold = 3 # Set the threshold for Z-score z_scores = (df[target_column] - df[target_column].mean()) / df[target_column].std() filter_outliers = z_scores.abs() > z_score_threshold
Step 4: Handle outliers
replacement_value = df[target_column].median() df.loc[filter_outliers, target_column] = replacement_value
Repeat the above steps for other targeted outlier handling strategies
Note that the specific technique for targeted outlier handling and the parameters used (such as threshold values) may vary depending on the data and problem at hand.
